Is CTOS Digital Berhad’s IPO Valuation Reasonable?

CTOS Digital Berhad looks set to emulate MR D.I.Y. Group (M) Berhad to becoming the most anticipated IPO for 2021.
With an indicative IPO price of 63 times its price to earnings ratio, many agree that valuation is steep.
But how to make a comparative analysis since CTOS Digital Berhad since it is one of the credit providing agency that is going to be listed?
Luckily just over the straits, there is a similar company available on the Singapore stock exchange. Credit Bureau Asia Ltd (SGX: TCU) is another credit rating agency that is in the same business as CTOS Digital Berhad.
Credit Bureau Asia Ltd went public just in December 2020. Hence with their latest FY 2020 Annual Report, we can actually conduct a comparative analysis between the two companies.
Head To Head Comparison

Revenue comparison
Both CTOS and Credit Bureau operate in the same business. But for a better comparison, it would be more accurate if both are at the same size.
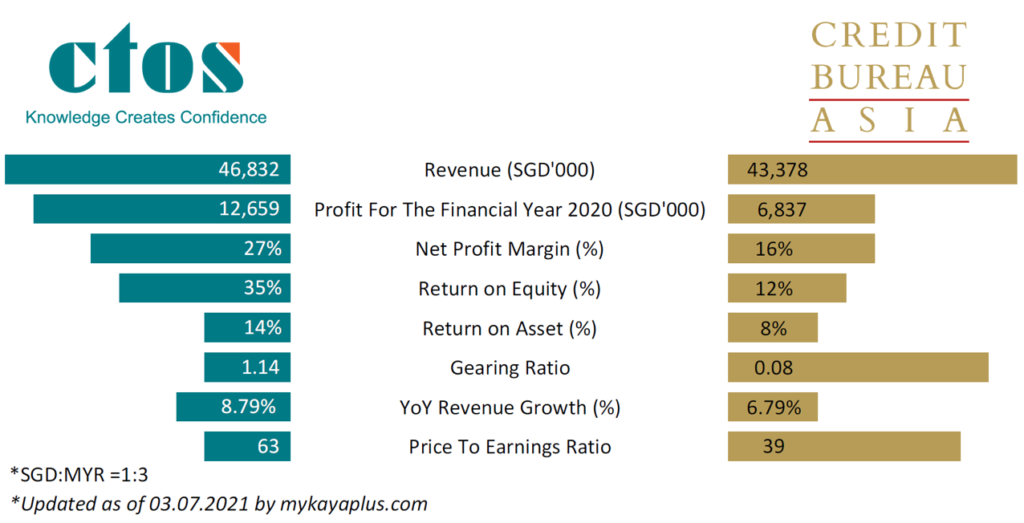
For FY 2020, CTOS Digital Berhad achieved revenue of RM 140.5 million. On the other hand, Credit Bureau Asia Ltd’s is at SGD 43.4 million. Upon standardizing the currency to Singapore Dollar, both companies are actually comparable in terms of size. CTOS’s revenue ekes out a bit more versus Credit Bureau Asia.
Companies that are operating in the same industry and scale would make the comparison more logical.
Net profit
CTOS net profit for 2020 is at RM 39.2 million, which translate to SGD 12.7 million. Its competitor Credit Bureau Asia manages to achieve SGD 6.8 million.
Due to a higher stake of non-controlling interests, Credit Bureau Asia’s profit attributable to owners of the company is at SGD 6.8 million. Profit attributable to non-controlling interests totals up to SGD 10.8 million.
Hence, CTOS has shown a far more high net profit margin due to less portion of its net profit is attributable to non-controlling interests.
Return on Equity & Return on Assets
Return on equity and return on assets are two of the most vital metrics to check on. It gives a gauge on how many returns a business is generating back, based on the assets it has and the equity it has.
Due to higher net profit, CTOS also has an edge versus Credit Bureau Asia when it comes to ROE and ROA. CTOS’s ROE and ROA is at 35% and 14%, while Credit Bureau Asia’s is at 12% and 8%.
Gearing Ratio
Higher ROE and ROA might also be contributed to high gearing. When both gearing ratios are compared side by side, CTOS has a gearing ratio of 1.14 while Credit Bureau has a gearing of 0.08.
It would be straightforward to assume that Credit Bureau takes the point this round for its lower debt exposure. But do note that 71% of the IPO proceeds of CTOS will be paring down the high gearing it currently has.
Growth rate
Since investing is all about the future prospects of a company, one key metric is to gauge its preceding growth rate. This would help give a gauge on what is the required growth rate for the company to continue growing.
Both CTOS and Credit Bureau Asia grew at a rate of 8.79% and 6.79% respectively. Even though it was a tough year, both companies’ businesses are relatively better off versus other sectors. They continue servicing banks and enterprises by providing valuable information to help facilitate businesses even during tough times.
Valuation
CTOS will IPO with a valuation of 63 times its trailing price to earnings ratio. It is indeed a steep valuation on paper. Compared to Credit Bureau Asia, which has a P/E ratio of 39 times, CTOS is 1.61 times more expensive than Credit Bureau.
MyKayaPlus Verdict
Price is what you pay and value is what you get. No doubt that CTOS does trump over Credit Bureau on a few of the highlighted metrics of comparison.
But how much more would you pay for CTOS for being a better company? Also, the ROE of CTOS would be expected to reduced after its current debt level is pared down. Once the IPO proceeds are captured on the books of CTOS, the ROE will be expected to go lower.
Since both companies are similar in size and prospect, does it make sense for one to be 1.61 times more expensive than the other?
Let us know in the comments!


