
Google V.S. Facebook – Which is a better investment?
Google and Facebook are both some of the biggest companies in the world. Often categorized as big tech companies, both companies are quite similar.
Both Google and Facebook are in fact in the advertising industry. Both companies have successfully become advertising titans from their respective websites and applications. Since most of their websites and apps are free to use and view, most of the monetizing mechanism comes from advertisement placements from companies and enterprises.
Hence, if you are looking to choose either one as an investing candidate, here are some points you should take note of when comparing Alphabet Inc. (NASDAQ: GOOGL) with Meta Platforms Inc (NASDAQ: FB).
This is a Premium Club Premium article made free to view for the public. Sign up for our Premium Club subscription to get premium analysis, articles and also access to Stock Plus 2022
1. Top and bottom line growth
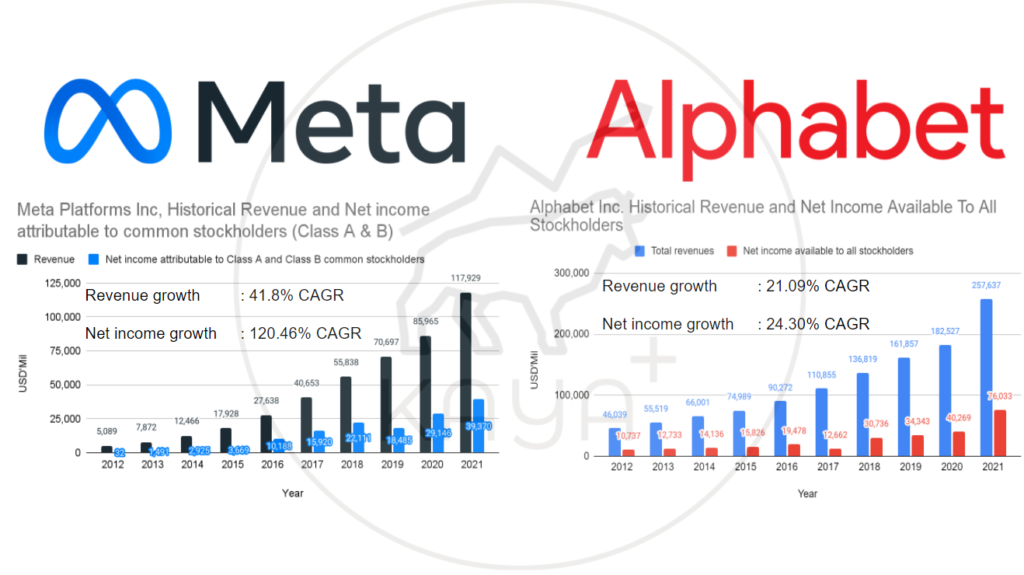
Even though of its recent lower growth guidance and a minor dip in its the United States & Canada Daily Active Users (DAU), Meta has grown tremendously YoY. Revenue is up 37.18% YoY and its past 9 years’ growth rate is at a CAGR of 41.8%. Net income has also grown by a CAGR of 120.46% for the past 9 years.
Alphabet, on the other hand, saw its top line grow by CAGR 21.09 % and bottom line by CAGR 24.30%. However, on a year on year basis, revenue surges 41.15% and net income is up by 88.81%. The growth spurt which Alphabet Inc encounters in its latest full fiscal year saw its share price pop up on the results.
Meta is a smaller company compared to Alphabet by revenue and market cap. But, the latest growth acceleration by Alphabet outpacing Meta’s growth rate year on year, might be one of the reasons for Meta’s selldown.
2. Advertising revenue growth
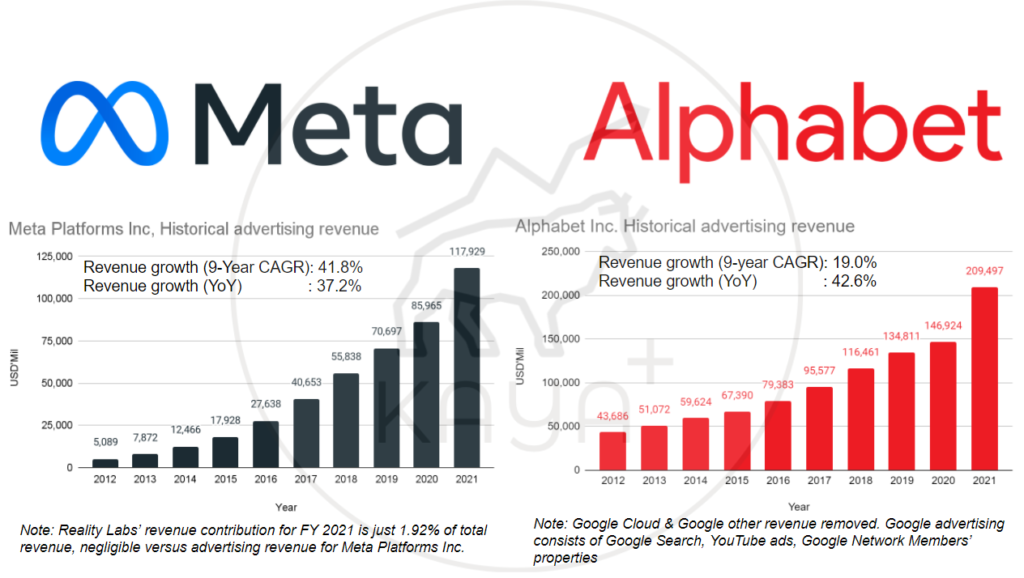
Given that Alphabet Inc has multiple revenue facets, to compare it against Meta Platforms Inc in a more apple to apple perspective, we strip out its cloud and other revenues.
Facebook too has reported its Reality Labs revenue separately in FY 2021. But due to a revenue contribution of just 1.92% of its total revenue, it was not separated. Again, due to the relative size, Facebook’s past 9 years of advertising revenue growth locks in at a CAGR of 41.8%.
Google, on the other hand, reports a trailing 9-year CAGR of 19.03% for its advertising revenue growth. But YoY wise, there is a 42.6% surge, driven by strong performances of Google Search & YouTube ads. Both subsegments under Google advertising grew at 43.1% and 45.9% respectively.
Facebook’s revenue YoY growth, on the other hand, came in at 37.2%. Even though the growth rate is still great, compared to Google, Facebook’s growth came out short.
3. Return on Assets & Return on Equity
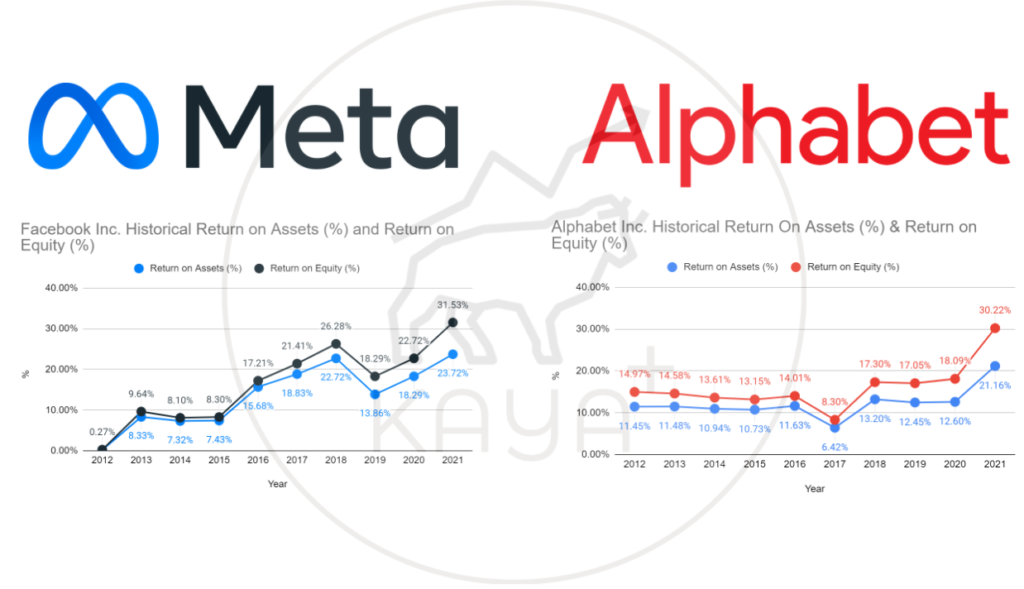
Return on assets and equity (ROA & ROE) measure how efficient a business’ profitability is in working its assets and generating shareholder returns.
Both Facebook and Google have seen their ROA and ROE growing for the last 10 years. Facebook’s ROA and ROE particularly have been growing well for the past 10 years. Google, on the other hand, has its ROA and ROE stable at a range of 10% to 18%. Only in FY 2021, there is a large surge, as returns grew at a faster rate than assets and equity.
4. Margins & profitability
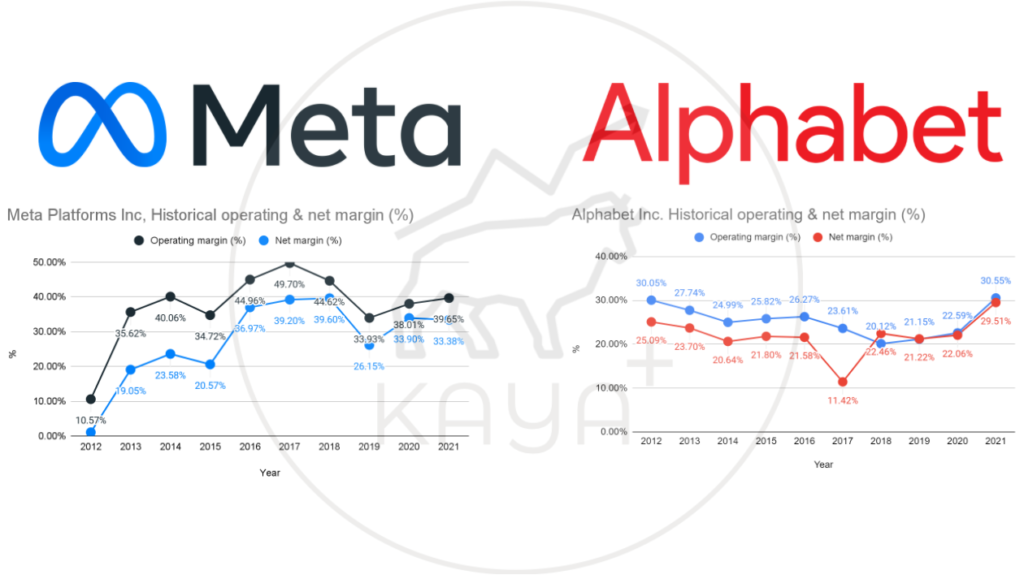
Both Facebook and Google exhibit relatively superior margins in the range of 25%-40%. Facebook margins improved YoY due to higher Average Revenue Per User (ARPU). Google on the other hand also saw its operating margin and net margin surge to 30.55% and 29.51% respectively.
Even though Facebook has higher margins compared to Google, Google’s operating and net margin growth of 796 basis points and 745 basis points easily routs out Facebook’s operating margin of 164 basis points. Facebook’s net margin even went down by 52 basis points YoY.
5. Earnings Per Share
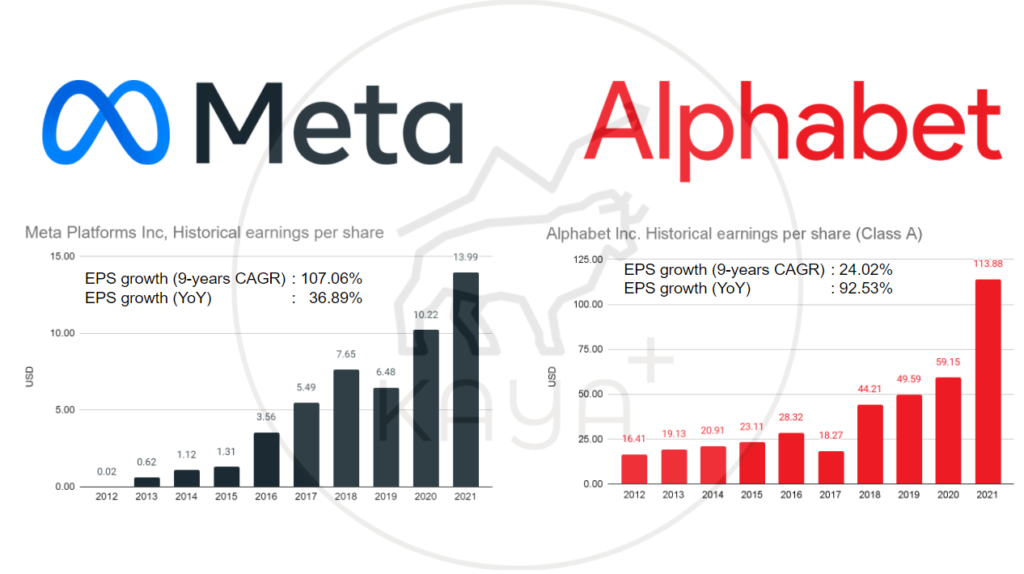
Advertising revenue and profits are the bread and butter of both Facebook and Google. Nevertheless, both companies are not resting on their laurels and are working on new verticals. Facebook has Reality Labs, where it is doubling down on VR hardware and software developments. Google, on the other hand, has its Google Cloud Platform which has been growing aggressively.

Nevertheless, both Reality Labs and Google Cloud are still in loss-making, hence the net income and earnings per share of both companies will be fully contributed by their advertising business model. Even though Facebook has experienced the most exciting earnings per share (EPS) growth for the past 10 years, its latest YoY growth stands at 38.89%. Google, on the other hand, manages to clock in an EPS growth of 92.53%, outstripping its 9-year CAGR rate of 24.02%.
MyKayaPlus verdict
There are multiple learnings and lessons that we can absorb by comparing both the performances of Facebook and Google. A great fiscal year is far better than a good fiscal year. Hence, Google stock prices popped while Facebook stock prices tanked.
Secondly, historical performances do not necessarily indicate the future potential of a company. Facebook’s explosive growth for the past 10 years does not ensure that it will continue to outgrow Google which is relatively at a bigger size and maturity.
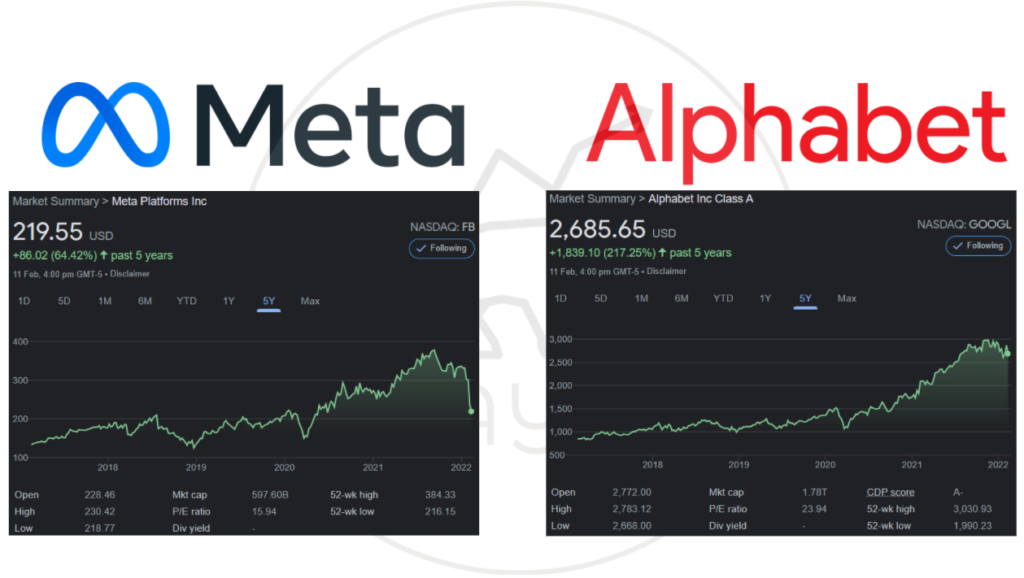
In terms of valuation, the recent selldown of Facebook and the earnings bump by Google see both companies actually trading within relative arm’s length. Facebook’s trailing P/E is current at 16x while Google’s is around 24x.
While Google’s prospects seem to be much clearer with its latest results, the relative valuation of both companies paints 2 sides of a coin for investors to choose. Is Facebook cheap, or is Google at a bargain?
Our opinion? Both are trading at fair valuation, just that Google’s horizon bears lesser clouds!