DBS, UOB & OCBC: Which bank’s FY22 is the fairest of them all?
This is a Premium Club Premium article made free to view for the public. Sign up for our Premium Club subscription to get premium analysis, articles and also access to Stock Plus 2023
DBS Group Holdings Ltd. (SGX: D05), United Overseas Bank Ltd. (SGX: U11), & Oversea-Chinese Banking Corp. Limited (SGX: O39) released their FY 2022 results.
Naturally, investors would be curious about which banks actually produce the best results among their peers.
With so many items to consider, we zoom down to the basic and important ones to determine which Singapore-listed bank is the fairest of them all.
1. Earnings per share growth
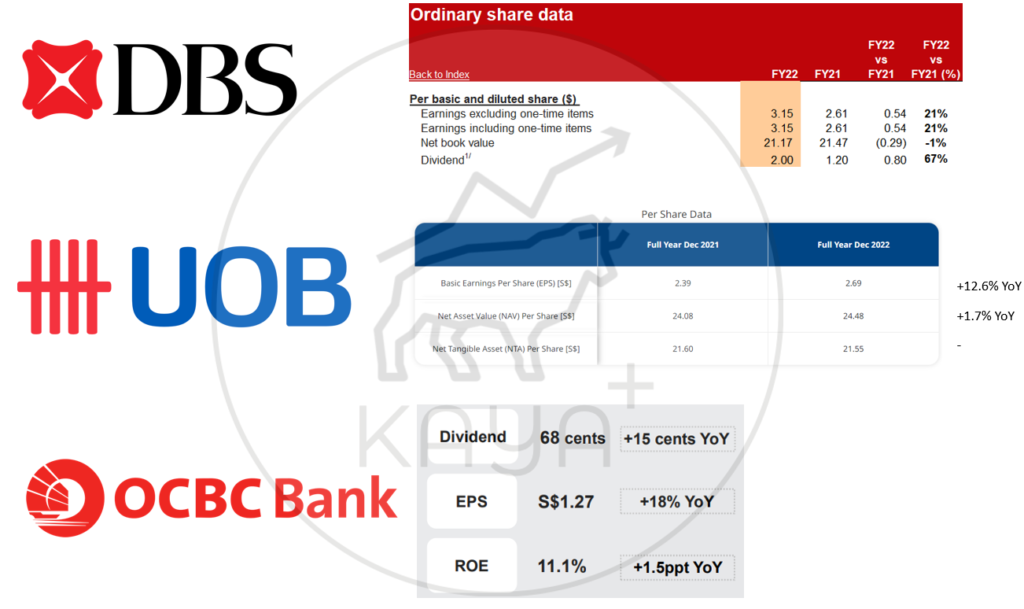
Earnings per share are the simplest ratio to check to determine shareholders’ returns. Any growth in net profit must also translate to better earnings per share.
DBS reported earnings per share of SGD 3.15 for FY 2022, up by 21% versus FY 2021. UOB’s earnings per share for FY 2022 is SGD 2.69, up 12.6% from FY 2021, while OCBC’s earnings per share of SGD 1.27 is a growth of 18% YoY.
Verdict: 1. DBS 2. OCBC 3. UOB
2. Dividends per share growth
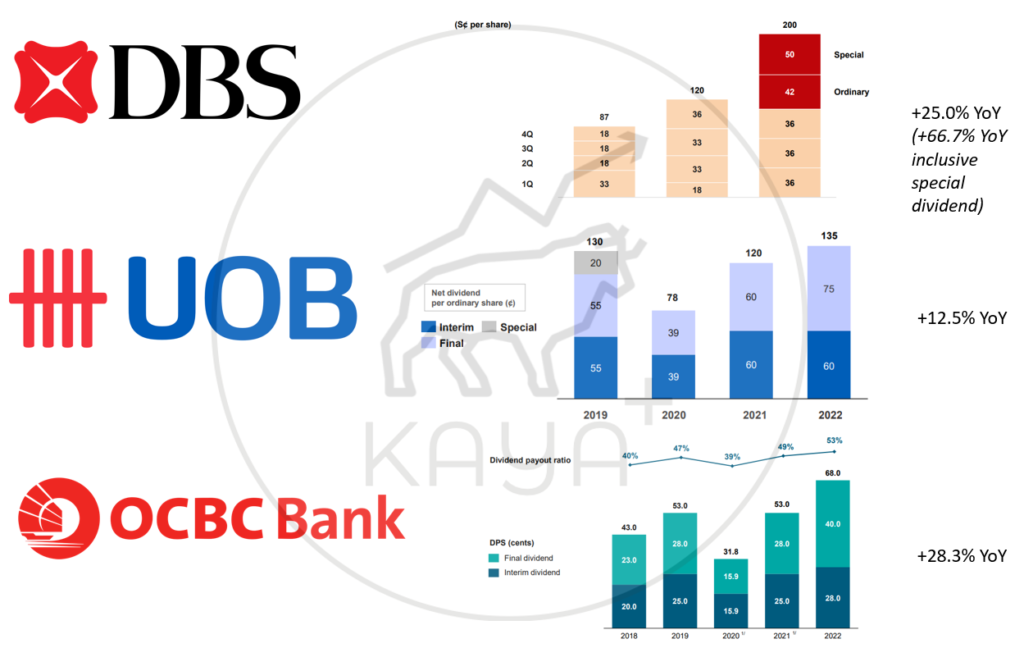
As banks are consistent and predictable dividend paymasters, any increase in earnings would surely result in an increase in dividends.
DBS FY’2022 total DPS chalks up an impressive SGD 3.00, inclusive of an SGD 0.50 special dividend. Factoring in this special dividend, the DPS growth comes out at a walloping 66.7% growth YoY.
OCBC comes in at second place with a final DPS of SGD 0.68 per share, a growth of 28.3% YoY.
Lastly, UOB’s DPS YoY registered a 12.5% YoY growth.
Verdict: 1. DBS 2. OCBC 3. UOB
3. Return on asset and equity
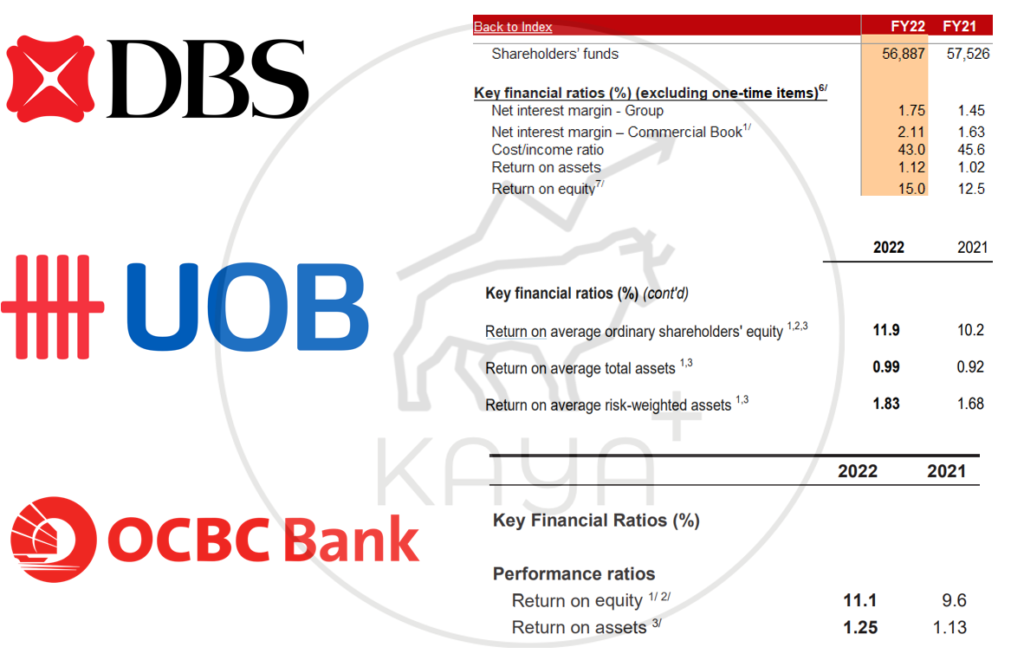
Moving on to the return on assets and equity. These 2 ratios are important in gauging how efficiently are each bank utilizing its assets and equity to generate net income.
DBS’ ROE for FY’22 is the highest among its peers, registering 15%. UOB pops up to the second place with an ROE of 11.9%, while OCBC is just 8 bps behind with 11.1%.
As of ROA wise, OCBC came in first with a ROA of 1.25%m followed by DBS with its ROA of 1.12%. UOB is 13 bps behind at a ROA of 0.99%.
Verdict: 1. DBS 2. OCBC 3. UOB
4. Allowance coverage
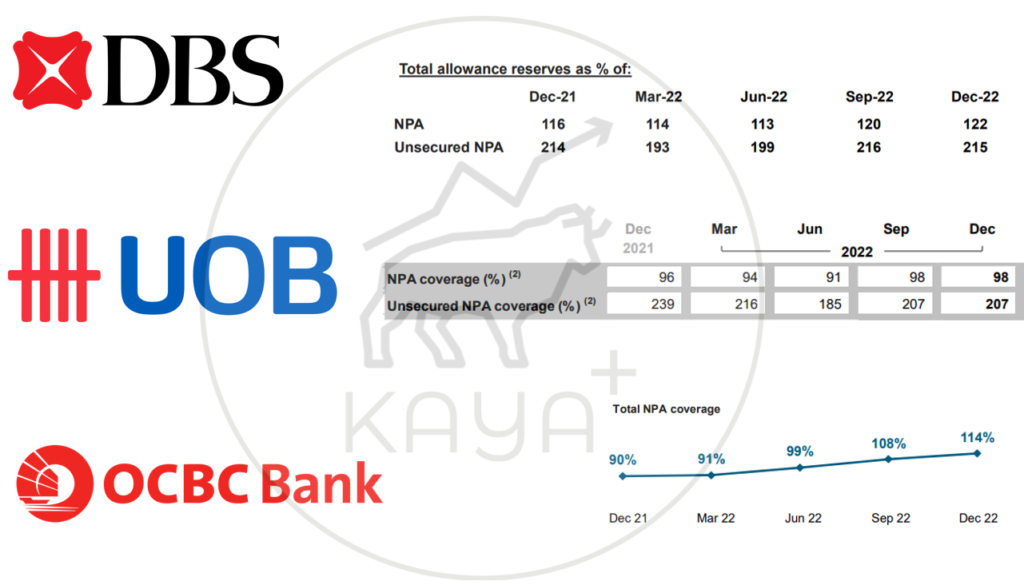
There are many ways to gauge a bank’s prudence in managing potential non-performing assets or delinquency.
One of these measures is allowance coverage. NPA coverage is the total expected credit loss (ECL) ALLOWANCE for assets divided by non-performing assets. It is also known as NPA reserve coverage.
A ratio of more than 100% means the banks have set aside more capital buffers to cover the worst possible case scenario, which is a total loss from the non-performing asset.
DBS’ NPA is the highest, coming in at 122%, with OCBC also impressive at 114%. UOB’s latest NPA is at 98%.
While it is highly unlikely that all of the NPA will end up as losses, the allowance level from a peer-to-peer comparison shows how defensive and prudent a bank chooses to be.
Verdict: 1. DBS 2. OCBC 3. UOB
MyKayaPlus Verdict
Based on FY 2022, DBS shines the brightest amongst its peer. However, standing from a neutral perspective, all 3 banks have done well in terms of growth.
There are some aspects where some banks pipped their peers just by a fraction, while there are some aspects where they hit a home run. It’s easy to gauge which bank has outperformed.
However, investing sometimes is not betting on the best horse of the year, but rather on one horse that can outrun in the long run.
Past performances can be a yardstick for comparison purposes. But it is the game plan and strategies of each bank to pip each other in the long run, that makes investing much more fun than just past results.