The Ultimate Malaysia Big 4 Glove Maker Comparison
(Updated 21.12.2019)
A while back, we did a side by side comparison of Hartalega Holdings Bhd V.S. Top Glove Corporation Bhd. Many of our readers have reached out to us, saying that we have neglected the other listed glove companies.
Well, we haven’t. Truth is since the month of October we had this crazy idea to put 4 of the biggest listed glove manufacturers of Malaysia on a side-by-side comparison to pique more interest and insights.
According to the Malaysian Rubber Glove Manufacturers Association (MARGMA), Malaysian gloves export is expected to grow from RM 18.2 billion to RM 20.68 billion in the year 2020. That is approximately an additional 14% of growth opportunity awaiting Malaysian glove makers.
Malaysian glove makers are not just fantastic glove makers for the local Malaysian market consumption. On the international stage, we actually dominate the global market share of the gloves demand. More than 50% of the gloves used around the world can find its way back to Malaysia as its origins.
So with gloves demand forecast picking up in the year 2020, who would be in pole position to take advantage of the burgeoning growth opportunities? As mentioned we are pitting the biggest 4 glove makers side by side. There are definitely smaller players also like Comfort Gloves Bhd & Careplus Group Bhd who can spring in surprises. But why we put our focus onto the big boys, is because the big boys have a more proven track record when it comes to growing the business with their competitive moat and more solid track record.
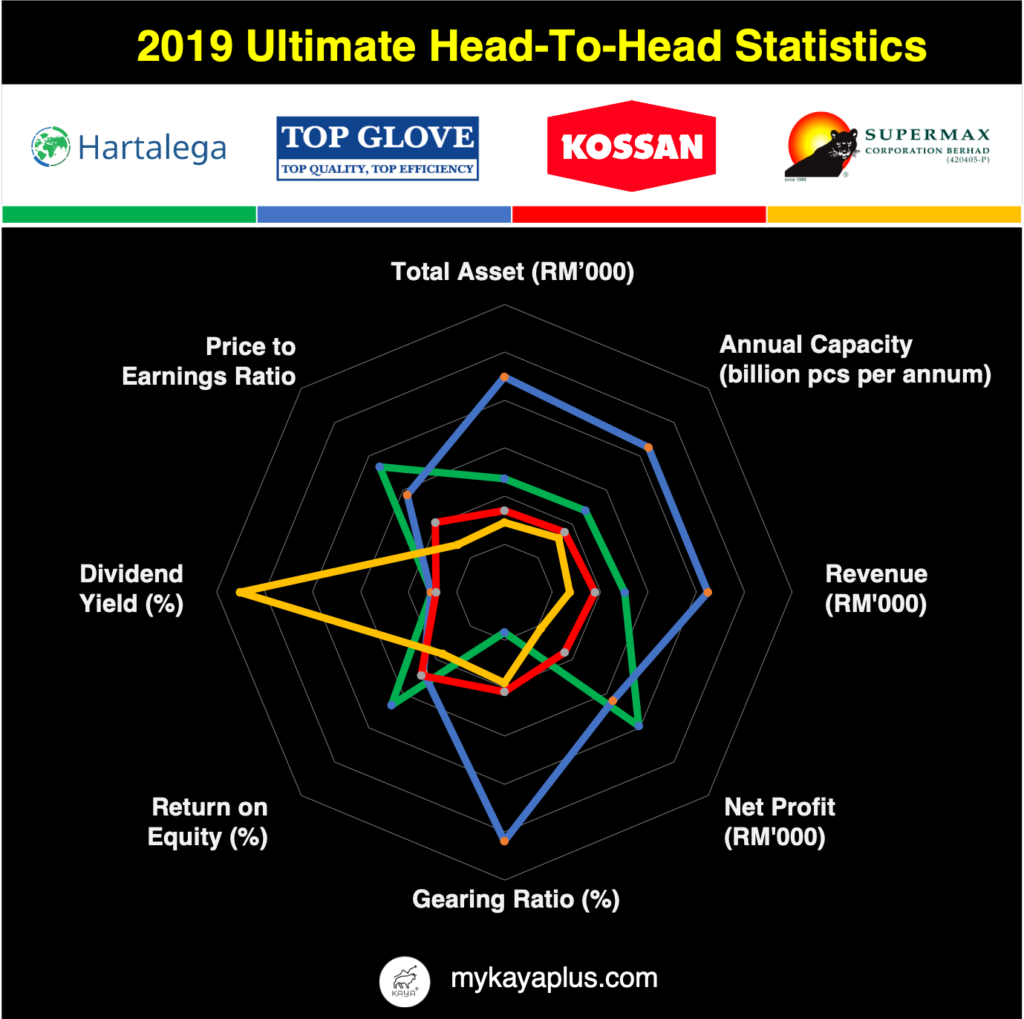
So let’s put the 4 biggest glove makers in a massive head to head battle. Who are the 4?
Hartalega Holdings Bhd, Top Glove Corporation Bhd, Kossan Rubber Industries Bhd & Supermax Corporation Bhd
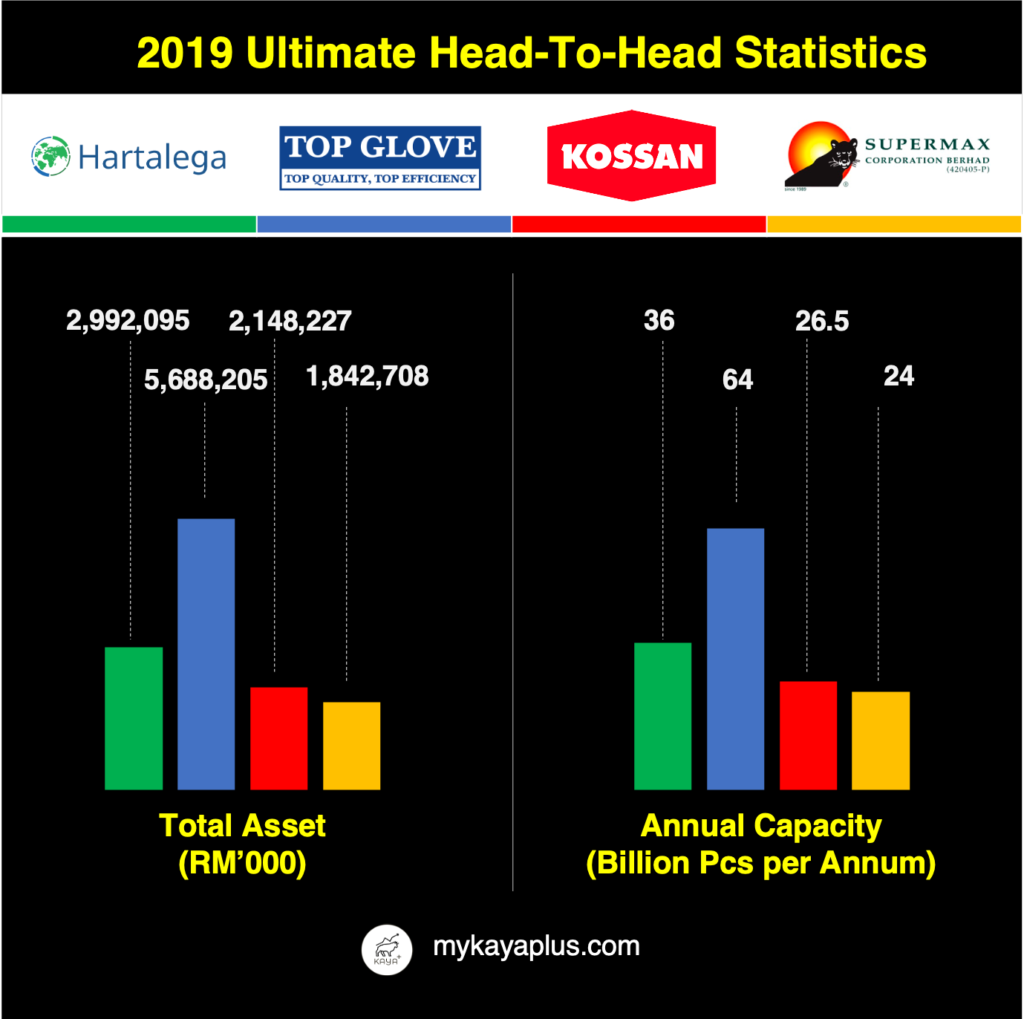
1. Total Assets

Let’s start with size. In terms of total assets, Top Glove Bhd takes the home run. Having total assets of RM 5.69 billion, the world’s largest glove manufacturer is actually bigger than Hartalega Bhd and Kossan Rubber Bhd added together!
Hartalega Bhd is quite far behind, with total assets valued at roughly RM 3 billion. Not far behind from Hartalega Bhd is Kossan Rubber Bhd at RM 2.15 billion. Supermax Bhd, the smallest among the four has RM 1.8 billion worth of total assets.
Verdict: Top Glove Bhd is the biggest of them all.
2. Total Annual Capacity
The crucial question to ask next when it comes to comparing output reliant companies. Is the biggest in size also the biggest output churner?
True enough, being the biggest in size and assets, Top Glove Bhd also emerges as the glove maker with the largest annual capacity, recording an annual capacity of 64 billion pieces per annum.
Hartalega Bhd, the second-largest in capacity size, has a capacity size smaller by 46% to Top Glove Bhd. Kossan Rubber Bhd and Supermax Bhd are neck-to-neck at 26.5 and 24 billion pieces per annum.
With size comes capacity. Due to its sheer size, Top Glove easily takes a bigger slice of the cake when it comes to market share.
Verdict: The biggest in terms of size, the biggest in terms of capacity. Top Glove is king when it comes to output.
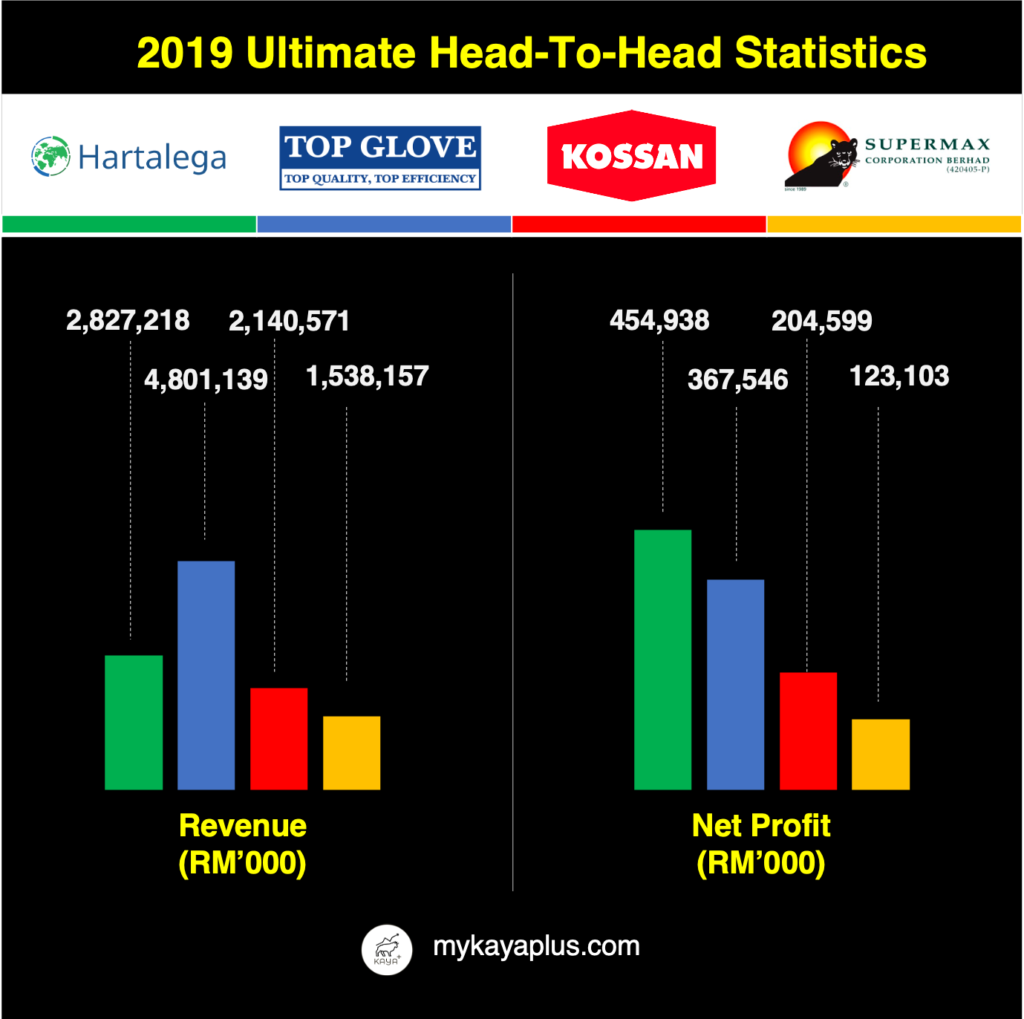
3. Latest Fiscal Revenue
Usually, the biggest in terms of size and capacity always clinches top spot for revenue. The same case applies in the glove-making sector. Top Glove Bhd registered revenue of RM 4.8 billion in its latest fiscal year. Lagging more than 50% behind is Hartalega Bhd. Kossan Rubber Bhd requires plenty of effort to catch up to Hartalega Bhd with its revenue of RM 2.15 billion while not forgetting to look behind to Supermax Bhd, which achieved RM 1.84 billion.
As big and as great its sales revenue and assets, we start to see some insights when we compare both revenue contribution from the assets of all 4 glove makers. Although Top Glove is the biggest in asset size and revenue, it requires RM1.19 worth of assets to generate RM 1 worth of sales (RM 5.7 billion / RM 4.8 billion). Hartalega Bhd on the other hand only requires RM1.06 worth of assets to generate RM 1 of sales. (RM 2.99 billion / RM 2.83 billion). Based on this simple ratio calculation, Hartalega Bhd is suddenly more efficient compared to Top Glove Bhd!
What about the other two? Kossan Rubber Bhd requires RM 1.00 worth of assets to generate RM 1 worth of sales while Supermax Bhd has an asset-to-revenue ratio of RM 1.2.
Verdict: In terms of revenue size Top Glove still aces. But in terms of efficiency, the smaller maker Kossan Rubber Bhd turned out to be more efficient!
4. Latest Fiscal Net Profit

Revenue is just the sales comparison. Eventually, an investor’s ultimate demand will be “Show Me The Money” Which glove-maker actually churns out the most profit?
Net profit-wise, Hartalega Bhd emerges as the winner over Top Glove Bhd by more than 24%! Hartalega Bhd’s net profit margin is at 16% while Top Glove’s net profit margin is just at 7.66%. Third-placed Kossan Rubber Bhd has a net profit of RM 204 million and a net profit margin of 9.56%. Supermax Bhd, even though last among the four with a net profit of RM 123 million, also boasts a net profit margin of 8%, which is still marginally higher than Top Glove.
Companies are always valued by their earnings and profits generated. Hartalega Bhd, shown to be more efficient and more profitable than Top Glove Bhd even though with lower sales, commands a higher price to earnings ratio. This is yet another classic example, where great companies are usually more expensive than their peers!
Verdict: One point to Hartalega Bhd for being the most profitable glove-making company!
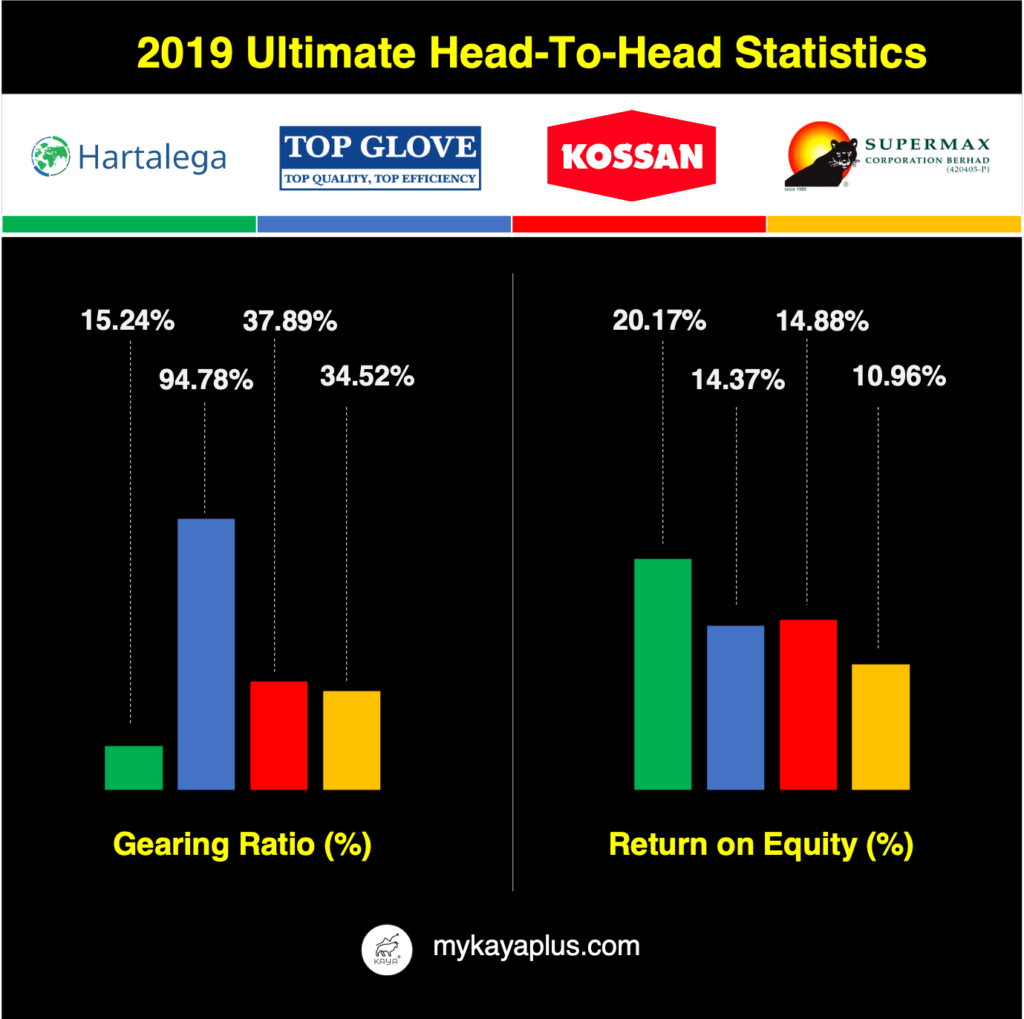
5. Gearing Ratio

As shown earlier, even though all 4 glove companies are already giants in their segments, the growth and demand for gloves are still very much on an increasing trend. Hence it is very vital all glove makers are always on the ball to expand their capacity to increase sales.
There are plenty of ways for expansion. It can be done either through acquisition (buying up smaller glove factories) or by building new factories from scratch. Of course, the effects in terms of expanding via acquisitions is that newly-purchases capacity can stack onto the existing output capacity. Expanding via building new factories is more time consuming, but on the other hand much cheaper.
To grow market share fast in such a competitive business landscape, Top Glove Bhd has chosen to do it via the acquisition method, which is by buying smaller glove companies. A large part of it is still funded via borrowings, hence when we look at the gearing ratio of Top Glove, it is on the higher side relatively, at almost 95%.
Hartalega Bhd has the lowest gearing ratio, which is at roughly 15%. Kossan Rubber Bhd and Supermax Bhd both have gearing ratios in the 35% region.
Indeed Top Glove does have a higher gearing, hence incurs more interest expense. Honestly, we think the gearing ratio is on the higher side, but since the current ratio and operating cash flow of Top Glove Bhd is strong, we are not that worried on any potential liquidity issue arising.
Verdict: Achieving more by doing less. Hartalega Bhd’s more conservative approach in expanding efficiently is an added point, which will boost with its future growth and profits.
6. Return on Equity

The favourite measure of all metrics of investment returns. Return on Equity (ROE) quantifies the investment returns of the capital invested by an investor.
As expected, the highest net profit company also turns out to be the company with the highest ROE. Hartalega Bhd recorded an ROE of 20%, far more superior than its peers. Second-placed Kossan Rubber Bhd is miles away with an ROE of close to 15%, pipping just a small advantage over Top Glove Bhd. Coming in fourth is Supermax Bhd with an ROE of 11%.
With an ROE 20% more than its peers, its no wonder that Hartalega Bhd’s price trades a far more premium. But if we looked back on what gave Hartalega Bhd its high ROE, it is due to its business efficiency, lower product defect rate, technical-know-how when it comes to building their lines from scratch, that contributes to an above-average profit margin.
Verdict: Hartalega Bhd takes this home by a mile. Impressive knockout win
7. Valuation

Why do we look at valuation always at the last step? Without knowing the advantages, peer-to-peer comparisons, it would be almost impossible to ascribe a fair value to each individual company.
Without knowing the fair value and factoring a discount factor for margin of safety, it actually lessens the odds of picking a stock that will provide a substantial investment return.
So out of the 4 companies, which company has the highest price-to-earnings ratio (P/E ratio) and dividend yield (D/Y)?

Hartalega Bhd. P/E ratio of 45x! Top Glove Bhd locked in a P/E ratio of 35x, which is also pricey by relatives. Kossan Rubber Bhd is at a P/E ratio of 25x, while in fourth is Supermax Bhd with a P/E of 17x.
Moving to the dividend yield, Supermax Bhd finally takes a surprise leap to first place, with a trailing yield of 5.63%, well above the other 3 of its peers. Top Glove Bhd offers a dividend yield of 1.57%, comes in at second place, which is whiskers away from Hartalega’s dividend yield of 1.55%. Not too far behind is Kossan Rubber Bhd, which gives a dividend yield of 1.46%.
So here comes the logical reasoning process. How did Supermax Bhd, with 0 points and winning edges against its competitors, be it in capacity, sales or even profits, turn out to be the champion when it comes to valuation?
The cheapest P/E ratio, the highest dividend yield. For most people, it’s a straight forward decision to buy Supermax Bhd. But after going through this comparison post, is the cheapest always the best?
After doing a simple but relatively thorough side-by-side comparison, it justifies Hartalega Bhd to have a P/E premium over its peers for its ability to register a much more higher profit. But by how much or reasonable a premium should be is down to everyone’s personal risk appetite.

MyKayaPlus Verdict
Historical financial analysis comparisons are just one of the few processes to gauge how efficiently a business is run, and how much the majority public is valuing a company. The forward prospects of a business sector, the competency of the management running the business, are the other vital aspects that can be the next catalyst of a business’ growth and profits.
So after going through the comparisons, which glove company would you invest in? Let us know in the comments section below!
If you are still unclear and want to learn more, do check out our Top Glove Corporation Bhd V.S. Hartalega Holdings Bhd post here
P.S. : Check out our May 2020 data in a sleek looking table here